Make the knowledge hiding in your slides and recordings searchable with AI
Slides, charts and diagrams carry meaning a transcript alone can't capture. Here's the method for making all of it searchable and citable, without watching every recording back.
There's an assumption built into most transcription tools: that everything worth capturing from a recording is spoken aloud. It isn't. A presenter says “as you can see in Figure 2,” and the transcript faithfully records that sentence, word for word, while Figure 2 itself, the actual chart, the actual number, disappears entirely.
In short: a transcript captures what was said. It doesn't capture what was shown. For an association sitting on years of webinar recordings, benchmarking reports and salary surveys, that gap is exactly where a lot of the most valuable, hardest-to-replace knowledge tends to live.
By the end of this, you'll know what a transcript alone will always miss, how AI can read a chart the same way it reads a paragraph, and how an answer gets tied to the exact minute of a recording rather than the whole thing.
Can AI understand the charts and slides inside our recordings, not just the audio?
Yes. A vision-capable AI model reads a chart or diagram the same way it reads a paragraph of text, working from the bars, the axis labels and the trend line directly, rather than relying on whatever a speaker happened to say about it out loud. This is what ReadyIntelligence's vision-capable retrieval does with your own reports and recordings.
That capability holds up outside a clean, straight-on slide too. An off-angle photograph of a stylised chart, taken on a phone rather than exported cleanly from a slide deck, still gets read correctly, bars, labels and all. The method doesn't depend on tidy source material.
That matters beyond simple bar charts too. The same approach extends to diagrams where the direction of an arrow carries real meaning, a process flow or a diagnostic chart, for instance, not just a value on an axis. For associations, that covers exactly the content type that tends to sit unopened for years: salary and benchmarking surveys, advocacy tracking reports, legislative scorecards, annual state-of-the-sector studies. All chart-heavy, all valuable, and until now, all searchable only by someone who happens to remember roughly where the number they need is.
None of this is a large project to set up either. Getting a first set of recordings and reports into this kind of pipeline typically takes about a week, with no separate development work required, the accuracy you gain comes from the method, not from custom-building anything.
How does an AI assistant point to the right part of a video?
The same way a citation points to a page in a document, except here it points to a moment in time. A recording processed this way is chaptered by topic, so instead of telling you the answer exists somewhere in a ninety-minute session, it can say it's between minutes 3 and 12, and take you straight there.
Under the hood, that means pulling the unique frames out of the video, extracting the meaning from whatever slide or chart was on screen at that moment, and tying it back to what was actually said alongside it. The result is a recording that behaves like a document: something you can query directly, rather than something you have to sit through.
Does this need a separate system from what we made findable already?
No. If your documents and FAQs are already searchable through a knowledge pipeline already covered, this plugs straight into it. Extracting knowledge from charts, slides and video is a different way of feeding sources into the same retrieval and permissioning system, not a separate one to build from scratch.
For most associations, this is squarely staff-side work: comms and events teams sitting on benchmarking surveys, advocacy tracking and years of recorded sessions nobody has time to watch back. That makes it a natural fit for your staff assistant, reaching into research and analysis material a member-facing assistant wouldn't need.
We call this a recipe: a specific, repeatable way to put AI to work, not just a good idea. This one, unlocking knowledge locked in charts, graphs and video, is the second in the series. If you haven't seen the others yet, this piece stands on its own, but it also builds on the same ingredients as the rest of this series.
Quick recap
- A transcript captures what was said, not what was shown, and that's exactly where a lot of an association's most valuable knowledge sits.
- Vision-capable AI reads charts and diagrams directly, from bars and axis labels to more complex diagrams, turning them into something searchable and citable.
- Chaptered video answers point to the exact minutes an answer came from, not just the recording it's buried in.
- None of this is a separate system. It plugs into the same knowledge pipeline as your documents and FAQs.
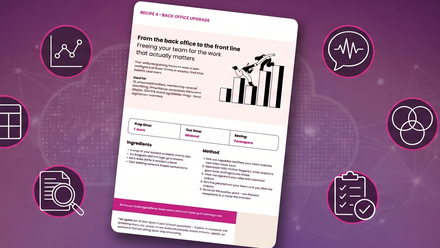
Want the details in one place? Download the recipe card for a one-page version of this method you can share with your comms and events team.
Ready to see it working? Start a free trial against your own recordings and reports.